MLAB has a very powerful contour map algorithm. It computes a matrix
holding the points on the individual level curves, so that their paths can be
used in further computations, as well as graphed when desired. (Many contour
algorithms produce plots, but do not produce explicit numbers, so nothing can be
done with such algorithms, except look at the produced plot.) The paths generated
with the MLAB
The MLAB
Some examples of contour maps produced in MLAB are given below.
The MLAB commands to do this are given below.
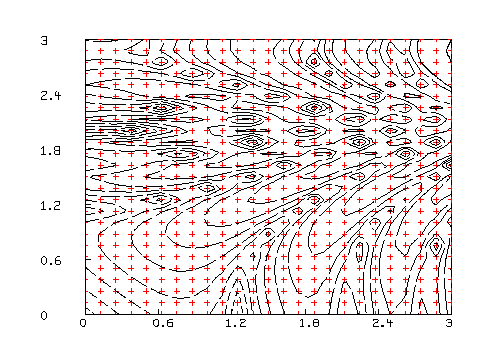
* FUNCTION F(x,y) = SQRT(ABS(COS(X^2-Y^3))) + LOG(1+ABS(X+Y))
* M = CROSS(0:3!25, 0:3!25)
* M COL 3 = F ON M
* DRAW CONTOUR(M) LINETYPE SVMARKER
* DRAW M COL 1:2, LINETYPE NONE, POINTTYPE CROSSPT, PTSIZE .01 COLOR YELLOW
* VIEW
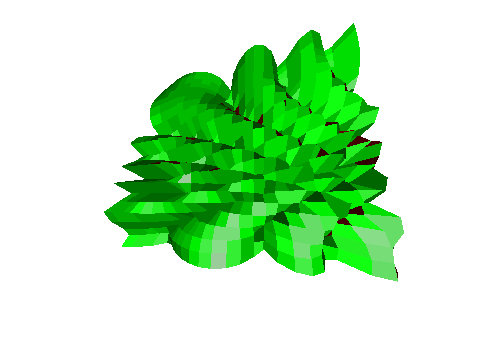
We can also look at our surface using the MLAB graphics facilities as follows.
* DELETE W
* DRAW M LINETYPE HIDDEN
* VIEW
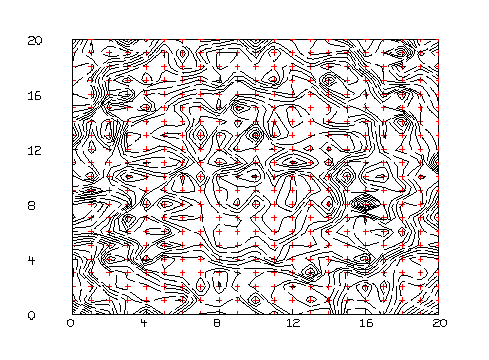
* D = READ(CDATA,21,21)
* D = CROSS(0:20,0:20) &' LIST(D)
* C = CONTOUR(D,30)
* DRAW C LINETYPE SVMARKER
* DRAW D COL 1:2, LT NONE, PT CROSSPT, PTSIZE .01, COLOR YELLOW
* VIEW
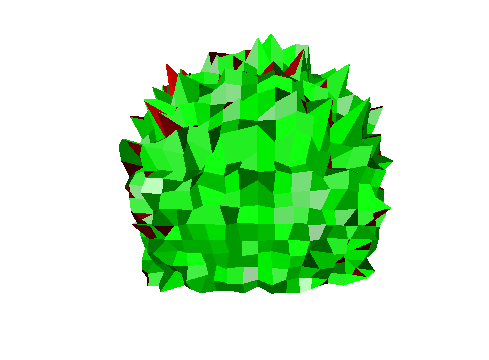
We can also look at our surface using the MLAB graphics facilities as follows.
* DELETE W
* DRAW M LINETYPE HIDDEN
* VIEW
Note we have not described how hard-copy plots are made, but this document shows plotting can be easily done.