Let F(t;x) = P[a subject with covariate values x = (x1, Ľ, xn) has a failure time Ł t]. The function F maps Rn+1 to R.
The associated density function is f (t; x) : = dF(t; x)/dt, and the associated survival function is S(t; x) : = 1 - F(t; x). The associated hazard function is h(t; x) : = f(t; x) / S(t;x). Note that log (h(t; x)) = log(f(t; x)) - log( S(t; x)).
Let C1, Ľ, Ck be independent identically distributed positive random variables. Ci represents the length of time beyond which subject i is not observed. If Ci < Xi then subject i is lost to follow-up, that is the survival time of subject i is unknown; we know only that subject i survived at least Ci years. Let Yi = min(Xi, Ci), and suppose we observe values (i.e. samples) y1, Ľ, yn of Y1, Ľ, Yk. When Ci < Xi, we say that the value yi is a censored observation. We will define the indicator code zi = 0 when yi is a censored observation and otherwise zi will be defined to be 1.
Now suppose we are given the data:
|
Thus subject j with the covariate values xj1, Ľ, xjn has the time to failure equal to yj when zj = 1, or alternately was lost to follow-up after time yj when zj = 0. Given this data, our goal is to construct a descriptive model, i.e. an estimate, for the underlying distribution function F.
We may form the likelihood function for this data as follows:
|
The corresponding log-likelihood function can be seen to be
|
Now suppose that F depends upon some parameters a = (a1, a2, Ľ,an) and b = (b1, b2, Ľ, bn). Then f, S and h also depend on the vectors a and b, and the log-likelihood function G is a function of a and b alone. Thus
|
If we postulate a specific form for F (and hence for S, f, h and G), we can estimate the parameters a1, a2, Ľ,an and b1, b2, Ľ, bn by choosing a and b to maximize G(a,b). This provides a potentially-enlightening descriptive model for our given data.
Piantadosi has proposed the model
|
where
|
|
This model defines F implicitly. In particular S satisfies the differential equation
|
Since S(t;x;a,b) ·h(t;x;a,b) = dF(t;x;a,b)/dt, this differential equation corresponds to the algebraic relationship:
|
and since a(x,a) > 0, b(x,b) > 0, t ł 0, and S(0;x;a,b) = 1, there is always a solution for S(t;x;a,b) in [0,1].
Now our log-likelihood function becomes:
|
In order to estimate a and b for this model via maximizing the log-likelihood, we may use the maximize functional in MLAB. An example of this for n = 3, where the parameters become a1, a2, a3,b1, b2, b3, is given below for the following data. Here x1 is fixed equal to 1 for all subjects in order to introduce constant terms in log(a(x,a)) and log(b(x,b)); and xi2 = 1 when subject i had treatment 1 and xi3 = 1 when subject i had treatment 2. The observed survival time for subject i was truncated (censored) if zi = 0.
|
Here is the MLAB dialog that uses the survival model in Piantadosi and Crowley, Biometrics (in press).
"log-likelihood function"
fct g() = sum(i,1,k,gt(alpha(i),betav(i), i))
fct gt(av,bv,i) = gs(logs(av,bv*t[i]/av), z[i],av,bv)
fct gs(ls,z,av,bv) = ls + z * (log(bv) - log(av+exp(ls)))
fct logs(av,ub) = root(w,0,ub,av*w+exp(w-ub)-1)-ub
fct alpha(i) = exp(a1*x[i,1]+a2*x[i,2]+a3*x[i,3])
fct betav(i) = exp(b1*x[i,1]+b2*x[i,2]+b3*x[i,3])

/* surv1, surv2 = survival function for treatment 1 and treatment 2 groups */
fct av1(s) = max(1e-30,exp(a1 + s*a2 + (1-s)*a3))
fct bv1(s) = max(1e-30,exp(b1 + s*b2 + (1-s)*b3))
fct surv(t,s) = exp(logs(av1(s),bv1(s)*t/av1(s)))
fct surv1(t) = surv(t,1);
fct surv2(t) = surv(t,0);

n = 3; "# of covariates "
k = 17; ßample size"

data = read(datafile,k,n+2)

x = data col 1:n
t = data col (n+1)
z = data col (n+2)

/* establish initial guesses */
a1 = 0; a2 = 0; a3 = 0; b1 = -2; b2 = -2; b3 = -2;

Hessmsw = 0; /* starting with identity Hessian */
maximize(g,b3,b2,b1,a3,a2,a1)

The function value is: -2.389855e+01
Argument(s): (-3.284358e-01 -7.916285e-02 -1.281012e+00
              -2.723759e+00 1.824017e+01 -1.877267e+01 )
Gradient: (3.302230e-01 4.906215e-03 1.718221e-01
          -4.880071e-05 -1.584679e-03 -1.723857e-03 )
# of function evaluations: 242
# of gradient evaluations: 99
# of Quasi-Newton iterations: 94
    = -23.8985504
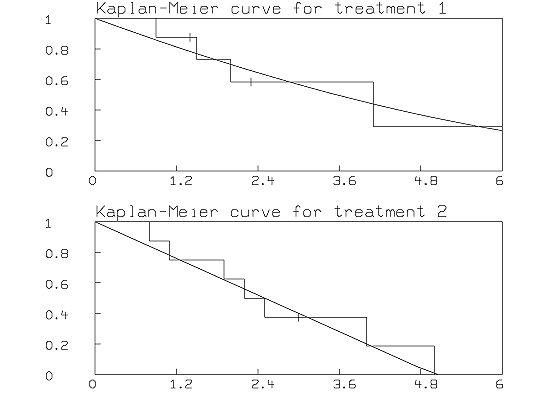
We will use the MLAB function KMSURV to compute and plot the two Kaplan-Meier survival curves and compare them with the estimated survival curves for treatment 1 and treatment 2.
/* draw the Kaplan-Meier curve and surv1 for treatment 1 in w1. */ d1 = compress(data,2); /* data for first treatment */ d = (d1 col 4) &' (d1 col 5) d = sort(sort(d,2,-1),1) "double sorting makes censored events occur in front of failure events if they happen at the same time." h1 = kmsurv(d); "Column (1,2) of h1 is the Kaplan-Meier survival curve for d" h = stepgraph(h1 col (1,2)) r = (0 &' 1) & h & (h[nrows(h),1] &' 0); "the graph starts at (0,1)" draw r, color red; "Draw the step-graph of the Kaplan-Meier curve" "draw censored data tic-marks" y1 = compress(d,2,1) col 1; ˙1 = the list of censoring times" fct f(x) = lookup(h,x) draw points(f, y1) lt none, pt vbar, ptsize .015, color green top title "Kaplan-Meier curve for treatment 1" frame 0 to 1, .5 to 1 "draw the estimated survival curve for treatment 1" draw points(surv1,0:6!20) w1 = w /* draw the Kaplan-Meier curve for treatment 2 in w2. */ d2 = compress(data,3); /* data for second treatment */ d = (d2 col 4) &' (d2 col 5) d = sort(sort(d,2,-1),1) h1 = kmsurv(d); "Column (1,2) of h1 is the Kaplan-Meier survival curve for d" h = stepgraph(h1 col (1,2)) r = (0 &' 1) & h & (h[nrows(h),1] &' 0); "the graph starts at (0,1)" draw r, color red; "Draw the step-graph of the Kaplan-Meier curve" "draw censored data tic-marks" y1 = compress(d,2,1) col 1; ˙1 = the list of censoring times" fct f(x) = lookup(h,x) draw points(f, y1), lt none, pt vbar, ptsize .015, color green top title "Kaplan-Meier curve for treatment 2" frame 0 to 1, 0 to .5 draw points(surv2,0:6!20) w2 = w view
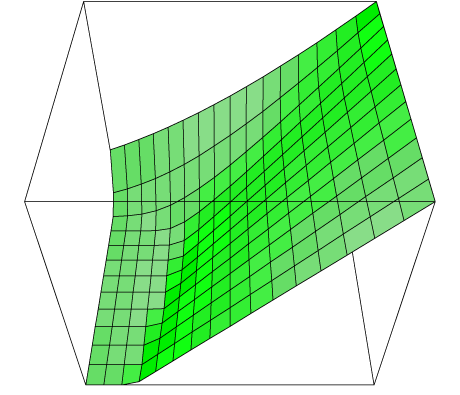
Here is the entire surface plot for the function surv.
M = cross(0:6!17, 0:1!13)
M col 3 = surv on M
del w1, w2
draw M lt hidden
view