Modeling Tumor Regrowth and Immunotherapy
Vladimir A. Kuznetsov, Gary D. Knott
Introduction
Tumors that originate in the body via a variety of
mechanisms usually grow slowly for some time. Many months or years may
be needed for the existence of such a tumor to manifest
itself. This near-steady-state existence of a tumor is
described by the term cancer dormancy [Uhr et al.,
1997][Vitetta et al., 1997]. Cancer dormancy is a
well-recognized clinical phenomenon in which malignant
cells persist for a prolonged period of time with little
or no increase in the tumor cell population. This state
may occur naturally, or following apparently-effective
therapy.
There are at least two plausible independent pathways to the clinically "quiescent state'' of a tumor. The first pathway corresponds to intrinsic properties of the tumor cells (related to the expression of suppressor genes, production of growth and/or anti-growth factors and corresponding receptors, etc.) The second pathway corresponds to approaching an equilibrium of interaction between the growing tumor cell population and various cellular and molecular components of the immune system. In either or both situations, the tumor appears to be dormant. Nevertheless, tumor dormancy is not necessarily a stable state. Many factors - infection, stress, immunodepression events, changes in endocrine status, etc. may disturb the balance between the host and the dormant tumor.
We will present a mathematical model for tumor growth and suppression below and show that this model can describe the regrowth of a dormant tumor by either of two distinct mechanisms. The first mechanism is a modest decrease in the efficiency of immune-suppression of the tumor which has, prior to this decrease, been able to maintain an equilibrium state wherein the tumor does not exhibit growth. Variants of this mechanism have been studied in [Kuznetsov, 1991] and [Kuznetsov et al., 1994]. The second mechanism we explore is the existence of a mutant clone of tumor cells which is not effectively suppressed by an immune response and hence grows unchecked, except for natural constraints imposed by nutrient resources.
In our model, tumor growth is reversed and then held in check by the continual attack of killer cells; however, when the equilibrium relationship between the killer cell and the tumor cell populations is suitably perturbed, the tumor "escapes'' control and grows.
Single Clone Model for Tumor Regrowth
Let c(t) denote the number of cancer cells present at
time t, measured in units of 1 million cells. Let
e(t) denote the number of cytotoxic killer cells
present at time t, measured in units of 1 million
cells. Then the growth-rate of the cancer cell
population is defined by the differential equation:
|
The term apec specifies the rate of destruction of tumor cells. We assume that killer cells bind with tumor cells, and that when this occurs then either (1) the tumor cell is destroyed, or (2) the killer cell is destroyed or inactivated. (The event that both cells are destroyed is deemed negligible.)
The parameter p is the probability that a tumor cell bound with a killer cells will be destroyed, and 1-p is the probability that a tumor-cell-killer-cell bound pair results in the killer cell being destroyed and the tumor cell surviving. The parameter a is defined so that a(1-p) is the rate of killer cell destruction (after binding with a tumor cell,) and ap is the rate of tumor cell destruction (after binding with a killer-cell.) Note that 1-a is the rate of neither cell killing the other after binding, and unbinding to try again. Thus, ap is the "kinetic'' constant that multiplies e and c to form the overall tumor-cell destruction rate term apec.
The growth-rate of the killer-cell population (which
changes size as new killer cells are attracted and arrive
via the lymph system) is defined by the differential
equation:
|
The expression f(t)c/(g+c) is a logistic growth rate expression in which f(t)= if t=0 then v else if t < u then 0 else v. (The notation "if D then E1 else E2'' defines a function with a discontinuity, so that (if D then E1 else E2) is the value of the expression E1 when the condition D holds, and is the value of the expression E2 otherwise.) The parameter v is the maximal rate of logistic growth of killer-cell population due to tumor growth, and the parameter u is the delay time of the immune response before "new'' killer cells can be applied to attack the tumor, i.e. u is the time for precursor cells to mature into killer cells. The function f "cancels'' its additional growth term until t > u. The parameter g is the mid-point (IC-50) logistic parameter in the additional arrival rate term. The parameter d is the natural rate of death of killer cells. Finally, the term a(1-p)ce is the rate of killer-cell death or inactivation due to the presence of H2 O2, gangliosides, cytolytic peptides produced by the tumor, etc.
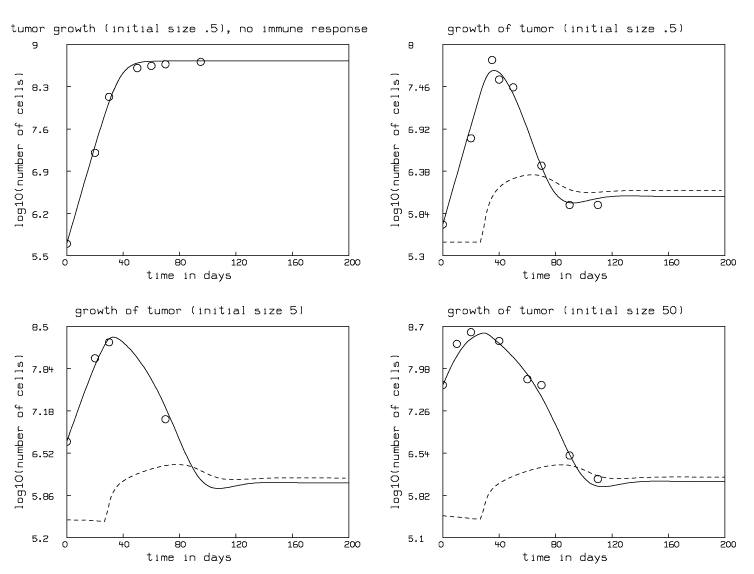
We have used the experimental data due to Sui et al. [Sui 1986], where BCL1 lymphoma tumor cells were injected into the spleens of chimeric mice, and the resulting tumor growth was followed. In particular we are given the mean number of tumor cells seen at various times in four groups of mice (numbered 0,1,2,3). These seeded tumors were initially of approximate size .5 million cells per mouse in group 0, .5 million cells per mouse in group 1, 5 million cells per mouse in group 2, and 50 million cells per mouse in group 3. In groups 1, 2 and 3 the resulting tumors respond to the action of the immune system. Group 0 mice have no immune response; tumor-size data from this group will be used to help estimate the parameters that define tumor growth by fitting the pure growth model c˘(t)=kc(t)(1-bc(t)) with c(0)=.5.
It is appropriate to both fit and view the data and our fitted models in logarithmic form; doing this is equivalent to weighting the data to assume the error in the tumor-size observations is more nearly log-normal than normal. The main purpose, however, is to introduce convenient units for both fitting and viewing. In order to fit the data, we replicated our model for each of the group 1,2, and 3 data-sets, and introduced the pure-growth differential equation model mentioned just above for the group 0 data. We have assumed that the initial number of killer cells contained in the spleen of the chimeric mice of groups 1,2, and 3 is .3 million, so, we used the initial conditions e(0)=e0 for each replicated differential equation, where e0=.3. This indicates that e0 106 is the number of killer cells that were initially present when the tumor cells were injected.
We used the MLAB mathematical and statistical modeling system from Civilized Software Inc., Bethesda, MD, (see www.civilized.com) to fit our models and draw the corresponding graphs, since MLAB is especially designed to deal with differential equation models, including large systems of stiff equations. (The differential equations being studied here are stiff.) For the four data-sets used, fitting our model consists of fitting four functions defined by seven differential equations to estimate the eight parameters d, u, v, p, a, k, b, and g. This fitting required various exploratory computations and careful search of the parameter space for suitable initial guesses that lead to physiologically-plausible values. Our result is d=.5910007682, u = 28.05445851, v = .524999404, p=.9982002827, a=.138698686, k=.1877015458, b=.001880059483, and g=.1607110637. Note particularly that 28 days is an appropriate estimate of the maturation time for CD8+ cytotoxic T lymphocytes. Figure 1 below shows this fit. Note for groups 1, 2, and 3, the tumor growth is suppressed and enters a equilibrium state of apparent dormancy. The limiting stable steady state of our model in this situation may be interpreted as the tumor dormant state.
The MLAB do-file (script file) that produced the above figure is given below.
/* file: fig1.do - study of delayed immune response (simple form)
		   fit of model to tumor growth data. */

reset
echodo=3

/* We are given the mean number of tumor cells in four groups
   (0,1,2,3) of mice at various times. These tumors were initially
   of size .5, .5, 5, 50 million cells per mouse in each group.
   In groups 1, 2 and 3 these tumors respond to the action of
   the immune system. Group 0 mice have no immune response;
   this group will be used to estimate the parameters that define
   tumor growth.

   Our model consists of two functions:
    e(t)=(# cytotoxic killer cells at time t)/10^6, and
    c(t)=(# cancer cells at time t)/10^6
   for groups 1,2, and 3, and just c(t) for group 0.
*/

/* no immune response group 0, initial size =.5,
   col 1 in units of days, col 2 in units of 10^6 cells. */
c0data col 1 =list(0, 20, 30, 50, 60, 70, 95)
c0data col 2 =list(0.5, 16, 135, 405, 440, 468, 513)

/* immune response group 1, initial size =.5 */
c1data col 1=list(0, 20, 35, 40, 50, 70, 90, 110)
c1data col 2=list(.5, 6.31, 63.1, 35.48, 28.18, 2.82, 0.89, 0.89)

/* immune response group 2, initial size =5 */
c2data col 1=list(0, 20, 30, 70)
c2data col 2=list(5, 100, 177.8, 11.22)

/* immune response group 3, initial size =50 */
c3data col 1 =list(0, 10, 20, 40, 60, 70, 90, 110)
c3data col 2 =list(50, 251.2, 398.2, 281.84, 63.1, 50, 3.16, 1.26)

/* transform data by taking log10 of # of cells */
fct l(x)=6+log10(x)
lc0d=(c0data col 1) '(l on (c0data col 2))
lc1d=(c1data col 1) '(l on (c1data col 2))
lc2d=(c2data col 1) '(l on (c2data col 2))
lc3d=(c3data col 1) '(l on (c3data col 2))

function l10(x)=6+log10(x+.000001)

function e1't(t)=.3*d +(f(t)*c1/(g+c1))*e1 -d*e1 -a*(1-p)*e1*c1
function c1't(t)=k*c1*(1-b*c1) -a*p*e1*c1
function lc1(t)= l10(c1)
function le1(t)= l10(e1)

function e2't(t)=.3*d +(f(t)*c2/(g+c2))*e2 -d*e2 -a*(1-p)*e2*c2
function c2't(t)=k*c2*(1-b*c2) -a*p*e2*c2
function lc2(t)= l10(c2)
function le2(t)= l10(e2)

function e3't(t)=.3*d +(f(t)*c3/(g+c3))*e3 -d*e3 -a*(1-p)*e3*c3
function c3't(t)=k*c3*(1-b*c3) -a*p*e3*c3
function lc3(t)= l10(c3)
function le3(t)= l10(e3)

fct f(t)=if t<u then 0 else v
function c0't(t)=k*c0*(1-b*c0) /* pure growth model */
function lc0(t)= l10(c0)

initial e1(0)=.3
initial c1(0)=.5

initial e2(0)=.3
initial c2(0)=5.

initial e3(0)=.3
initial c3(0)=50.

initial c0(0)=.5

/*parameter guesses (best-fit guesses used.) */
u= 28.05445851
d=.5910007682
v= .524999404
p=.9982002827
g=.1607110637
a=.138698686
k=.1877015458
b=.001880059483

errfac=.000001
method=gear
disastersw=-2

fit(k,b,u,d,v,p,g,a), lc0 to lc0d, lc1 to lc1d, lc2 to lc2d, lc3 to lc3d

/* draw the graphs */
m=points(lc0,le1,lc1,le2,lc2,le3,lc3, 0:200!166)

/* group 1 data fit */
draw lc1d pt circle lt none color red
draw m col (1,3) lt dashed color red /* graph le1 vs. t*/
draw m col (1,4) color red /* graph lc1 vs. t*/
left title "log10(number of cells)"
bottom title "time in days"
top title "growth of tumor (initial size .5)"
frame .5 to 1, .5 to 1
w1=w

/* group 2 data and fit */
draw lc2d pt circle lt none color yellow
draw m col (1,5) lt dashed color yellow /* graph le2 vs. t*/
draw m col (1,6) color yellow /* graph lc2 vs. t*/
left title "log10(number of cells)"
bottom title "time in days"
top title "growth of tumor (initial size 5)"
frame .0 to .5, 0 to .5
w2=w

/* group 3 data and fit */
draw lc3d pt circle lt none color green
draw m col (1,7) lt dashed color green /* graph le3 vs. t*/
draw m col (1,8) color green /* graph lc3 vs. t*/
left title "log10(number of cells)"
bottom title "time in days"
top title "growth of tumor (initial size 50)"
frame .5 to 1, .0 to .5
w3=w

/* group 0 data fit */
draw lc0d pt circle lt none color green
draw m col (1,2) color orange /* graph lc0 vs. t*/
left title "log10(number of cells)"
bottom title "time in days"
top title "tumor growth (initial size .5), no immune response"
frame .0 to .5, .5 to 1
w4=w

view
/* end of fig1.do */
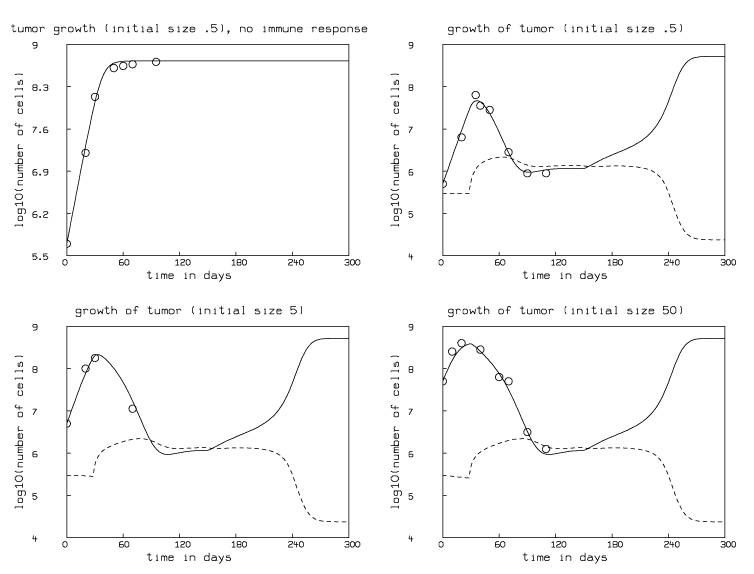
Now, if we modify our model to have the parameter p change from 0.9982002827 to 90 percent of that value after 150 days, then tumor regrowth is exhibited as shown in Figure 2. This is done by replacing p in our seven differential equations by the expression h(t), and defining h(t)= if t < 150 then p else .9p. This result indicates that a modest decrease in the immune response effectiveness, corresponding to a small increase in the proportion 1-p of killer lymphocytes being inactivated by tumor cells, dramatically changes the outcome of the disease.
It is worthwhile to note that suitably changing the immune response parameters v, d, or k can produce a similar regrowth event. However, increasing the parameter g from 0.16 to 5 did not change approaching the tumor dormancy steady state. Thus our modeling suggests that regrowth of dormant tumor may be associated with diminishing immune system activity, caused by a variety of mechanisms. Many immune functions are reduced with age or chronic stress. We explored the effect of diminishing the various immunological parameters in our model; we observed that slowly reducing the parameters p, v, d, or k with age also induced regrowth of the dormant tumor.
Two Clone Model for Tumor Regrowth
Another explanation of tumor regrowth is that there is a
small population of immune-resistant cancer cells that
are either initially-present or that develop and which
grow unchecked by the action of killer cells. We can
explore the behavior of such an aberrant clone
population by introducing a pure growth model for such a
population via the differential equation
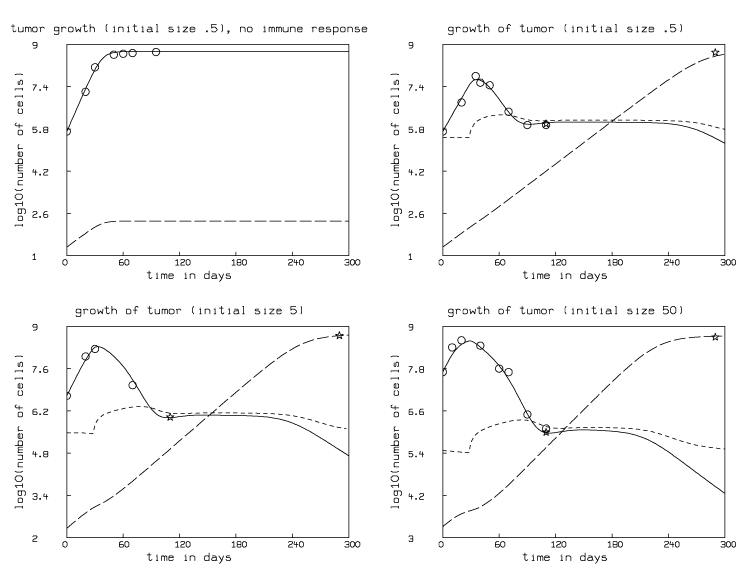
m˘(t)=.33km(t)(1-b(m(t)+c(t))) with
m(0)=sc(0) and modifying the growth term
kc(t)(1-bc(t)) to be kc(t)(1-b(m(t)+c(t))) in the
differential equation that defines the function c. The
parameter s is the proportion of the initial
population of cells that matches the size of the initial
population of aberrant immune-resistant cells.
Thus, the two clones model for cancer regrowth is written:
c'(t) = kc(t)(1-b(c(t)+m(t)))-ape(t)c(t)
m˘(t) = .33km(t)(1-b(m(t)+c(t))),
e˘(t) = r+(f(t)c(t)/(g+c(t)))e(t)-de(t)-(a(1-p)c(t))e(t),
with c(0)=c0, m(0)=sc0, e(0)=e0, and f(t)= if t < u then 0 else v, where e0=.3 and c0 is variously equal to .5, 5, and 50.
We can estimate the value of s that causes the total tumor size c(t)+m(t) to rise to the value 500 after 290 days by simultaneously curve-fitting replicates of the function c(t)+m(t) to the point (290,500) for groups 1,2, and 3, along with the data for each group of chimeric mice. We also fit these model functions to the additional data point (110,1), corresponding to 106 being the number of dormant tumor cells present initially at days 100 to 110 as estimated in [Uhr et al., 1997]. MLAB permits such simultaneous fitting of many functions indirectly defined by differential equations. We obtained s=4.081604·10-5±1.86·10-5. The result is shown in Figure 3.
Simulation of Immunotherapy for an Established Dormant Cancer
Inducing an increased presence of various cytokines,
chemokines and/or other immunomodulators in tumor tissue may
augment the function of the immune system, and this can
accomplished via vaccine agents.
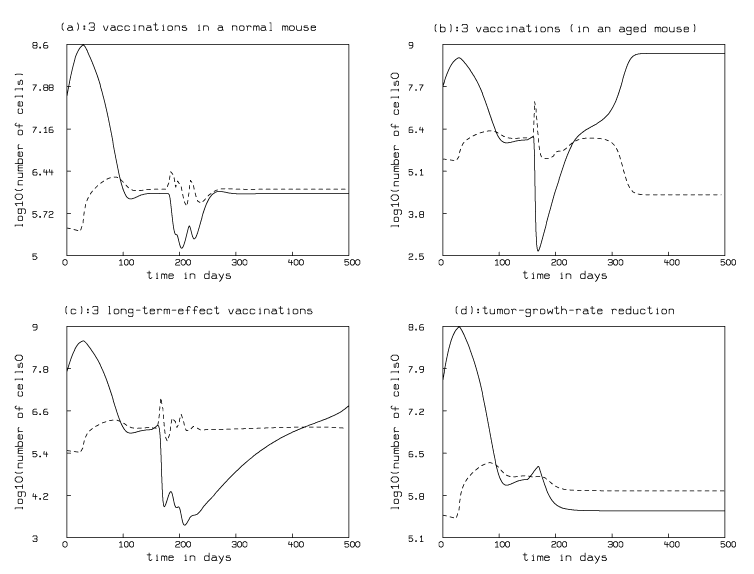
In Figure 4 below, we show the results of numerically simulating the effects of changing the dynamics of the immune system via various vaccine regimes, thus modifying its action on an established dormant tumor. Such a change will result in reducing the tumor mass. However, generally this response is temporary, and tumor regrowth may occur after stopping the immunotherapy and thereby reducing the influx of killer cells.
Figure 4a shows the result of increasing the flow of killer cells into a dormant tumor in three steps due to three imagined vaccine immunization treatments administered on days 180, day 194, and day 215. The modeled tumor is characterized by the parameters of a "normal'' mouse obtained by fitting and exhibited in Figure 1. In this case, we assume the vaccination provokes a temporary rise in the size of the population of killer cells available to attack the tumor; this increase is independent of the (dormant) tumor-size. This is done by modifying the "base arrival rate'' .3d by multiplying by factors that are temporarily greater than one, corresponding to each vaccine injection.
The therapeutic effect of vaccination shown in Figure 4a
was modeled by the following equations.
| ||||||||||||||||
| ||||||||||||||||||||||||||
The function w(t,z) is 0 until time z; at time z it rises to a maximum of nearly 3 at about time z+7 (indicating a 4-fold increase of the arrival-rate of killer cells); and thereafter exponentially decays to nearly 0 by day z+18.
We used the initial conditions e(0)=.3, c(0)=50 and the parameter values used for Figure 1, together with u1=180, u2=194, and u3=215.
Figure 4b shows the result of modeling such imagined immunizations beginning ten days after tumor regrowth has started in a mouse with a diminished immune response as modeled in Figure 2; thus, the vaccinations occur at days 160, 174, and 195. Also, in this case, we assume our vaccine works by increasing the proliferation of killer cells in response to the logistic tumor size function, rather by increasing the arrival rate independently of the tumor size. This is done by multiplying the tumor-size dependent growth term for the killer cell population by factors which are temporarily greater than one, rather than modifying the base arrival rate as done above. Also, we assume that, although the number of killer cells increases in response to vaccination, their effectiveness, as measured by the parameter p, remains diminished at a level 10% lower than the "normal'' mice modeled in Figure 1.
Our model is given by the following differential equations.
| ||||||||||||||||||||
The effects of the vaccinations are here described by the "multiplier'' function, q, defined in terms of the functions f1, f2, f3 and w given above; f1, f2, f3, and w are defined as they were above, except that u1=160, u2=174, and u3=195.
We used the initial conditions e(0)=.3, c(0)=50 and the parameter values used for Figure 2, together with u1=160, u2=174, and u3=195.
Figure 4c shows the result of our simulation of the
effect of immunotherapy by injecting immune memory cells
in a mouse with a regrowing tumor due to a diminished
immune response as modeled in Figure 2 (and Figure 5b.)
We assumed that, soon after injection, the memory cells
will increase the immune response to the tumor due to
enhanced stimulation of the production of killer cells
for a period of about 150 days.
This mechanism of adaptive immunotherapy is modeled
with the differential equations:
| ||||||||||||||||||||
The effects of the vaccinations are here again described by the "multiplier'' function, q, defined in terms of the functions f1, f2, f3 and w; f1, f2, and f3 are defined as they were above, except that u1=160, u2=174, and u3=195. The function w has the same form as before, except that it has been "lengthened'' (by changing .35 to .35/10 and .4 to .4/10) to correspond to an enhanced rate of proliferation of killer cells proportional to the logistic tumor size for a time period of about 150 days.
We used the initial conditions e(0)=.3, c(0)=50 and the parameter values used for Figure 2, together with u1=160, u2=174, and u3=195.
Figure 4d depicts the simulated situation where we modeled administering a "cytostatic'' drug that has the effect of reducing the logistic growth-rate parameter k that governs the rate of tumor regrowth; this might be an agent that reduces the tumors' nutrient supply, for example. In particular, we again used a reduced immune response mouse as described in Figure 2 which exhibits tumor regrowth starting at day 150. We imagine administering a drug that cuts the value of k in half on day 170. This is done mathematically by replacing k with the function l(t)= if t < 170 then k else k/2.
Discussion
The assumption that, after the introduction of tumor
cells (at time 0), no enhanced immune response occurred
during the first 28 days after the mice were challenged
with such injections was key to obtaining the excellent
fits exhibited in Figure 1. The probability of
inactivation of an immune killer cell after binding to
a tumor cell is also a crucial parameter of the model.
The value of p, as well as the numerical values of
the other kinetic parameters of our model, are typical
of the kinetic characteristics of CD8+ cytotoxic T
lymphocytes involved in the allogenic immune response
in mice.
We have studied two related mechanisms of tumor regrowth. The first model predicted that a small permanent reduction in the level of antitumor immune response may provoke the regrowth of a monoclonal tumor from a dormant state. Reducing the probability of killing or inactivation of a tumor cell by an immune killer lymphocyte, or reducing the rate of arrival of the immune lymphocytes into the tumor region, were the most critical factors in inducing the model to exhibit tumor regrowth. Various factors (i.e. aging, stress, infection, etc.) may explain why such a tumor-growth-inducing change might occur.
The second two-clone tumor model also agreed with the experimental observations. Under the assumption that a small fraction (0.33%) of the tumor cell population injected initially into the mice is non-immunogenic and that the growth of this clone is three times slower than the growth rate of the major immunogenic tumor cell population, this model unsurprisingly predicted eventual tumor regrowth. Unlike our first model, This second model also predicts that size of the tumor after dormancy is determined by the initial number of injected tumor cells. Variability of initial doses of injected cells explains the high dispersion of the time of clinical detection of regrown tumor after dormancy [Vitetta et al., 1997], under the assumptions of our second model. Moreover, immunological abnormality of a minor fraction of BCL1 lymphoma cells was reported in the same study[Vitetta et al., 1997].
Note that the curves describing tumor regrowth presented above have distinct shapes. It would be interesting to see if tumor regrowth known to be due to immune system decline matches the regrowth profile in our first model while tumor regrowth due to the presence of a abnormal clone matches the regrowth profile of our second model.
Clinical and experimental observation confirms that intensive limited-term immunotherapy does not provide complete tumor elimination, as predicted via modeling. Immunotherapy may reduce tumor mass to a handful of cells; however, if the functional activity of the immune system is slightly impared, tumor regrowth after immunization is likely. Model-fitting predicts that the life-time of killer cells is short (about 2 days). Medium-term control of cancer is exhibited when long-life immune memory cells are activated due to our simulated immunization. But long-term control results from reducing the cancer growth-rate.
REFERENCES
Kuznetsov, V.A. (1991) A mathematical model for the interaction between cytotoxic T lymphocytes and tumour cells. Analysis of the growth, stabilization, and regression of a B-cell lymphoma in mice chimeric with respect to the major histocompatibility complex. Biomedical Science 2 465-476
Kuznetsov, V.A., Makalkin, I.A., Taylor, M.A., Perelson, A.S. (1994) Nonlinear dynamics of immunogenic tumors: Parameter estimation and global bifurcation Analysis. Bull. Math. Biol., 56(2), 95-119
Sui, H., Vitetta, E.,S., May, R.D., Uhr, J.W. (1986) Tumor Dormancy I: Regression of BCL1 Tumor and induction of a dormant tumor state in mice chimeric at the major histocompatibility complex. J. Immunol., 137, 1376-1382
Uhr, J.W., Scheuermann, R.H., Street, N.E., Vitetta, E.S. (1997) Cancer Dormancy: Opportunities for New Therapeutic Approaches. Nature Med., 3(5), 505-509
Vitetta, E.S. Tucker, T.F., Racila E. Huang, Y.W., Marches, R., Lane, N., Scheuermann, R.H., Street, N.E., Watanabe, T., Uhr, J.W. (1997) Tumor dormancy and cell signalling. V. Regrowth of the BCL1 tumor after dormancy is established. Blood, 89(12), 4425-4436